 |
MFJ-762 Step Attenuator |
Greg Ordy
Wouldn't it be nice to have a calibrated S Meter?
I like to experiment with antennas, especially low-band receiving arrays. What often matters is increasing the front to back (F/B) ratio in order to improve the signal to noise ratio. A calibrated S Meter could be used to measure the F/B ratio.
Perhaps a station you are talking to decides to turn on their amplifier, and you would like to measure the decibel (dB) difference in signal strength when the amplifier is used.
Maybe you or another station has more than one antenna for a given band, and you would like to have a more accurate idea of the relative performance difference between them.
Any S Meter can be used to answer the question: which is stronger? And while that is certainly an important question, it is much more informative to understand how much stronger?
Here's a situation that most of us have been in. The other station turns on their amplifier, and their signal goes from S7 to S9+5 dB. Let's see, there are 6 dB per S Unit, so the total difference is 2 S Units (12 dB) plus the 5 dB over S9, for a total of 17 dB. The amplifier added 17 dB to the signal strength - right? This answer makes several assumptions that are usually incorrect.
Several years ago, after I purchased a Yaesu FT-920 radio, I learned that it was possible to read the S Meter from the computer interface. Since the meter on the 920 was one of those rather coarse bar graph meters, I decided to write a program that would taken readings from the radio, and display them on a graph in a window. This was the start of what became my S Meter Lite software, available on another page. In developing the software I naturally found myself investigating the accuracy of S Meters. I looked at my own radios, and the radios of several nearby friends and amateurs. This web page summarizes some of the measurements I made. The bottom line is that most S Meters are not very accurate or consistent. If you take the time to understand how your meter responds, usually by spending several hours with a step attenuator and an RF signal generator, you will probably be rather surprised, and you should become able to make much more informed statements about relative signal strengths obtained from your S Meter.
The S Meter is the signal strength meter on your receiver. The stronger the signal, the higher the meter reading. I think that is about the only statement I can make with some certainty. That is, I have never seen an S Meter go down (in level) as a signal goes up (in strength). Beyond that, all bets appear to be off.
The scale of most S Meters is a combination of S Units and decibels. The lower (left) portion of the meter goes from S0 to S9. S9 is usually somewhere near the middle of the scale. Above S9 (to the right), the scale shifts to decibels. The decibel portion is usually marked from 0 to 60 dB. Because S Units and decibels share a common scale, it is reasonable to believe that they are related, and potentially convertible from one to the other. More on that later.
I suspect that part of the accuracy problem is that most S Meters are not implemented as a dedicated signal strength measuring circuit, but rather as an add-on to the automatic gain control (AGC) circuit. The rest of this section is a basic description of a large class of receivers that follow the described design philosophy.
The signals that arrive at our antennas vary over a tremendous strength range, well over 100 dB. The loudest signal may be over a billion times stronger than the weakest signal. The ideal receiver would process all of the signals so that the audio output level is constant. We could set the audio gain control to a pleasing level, and no matter what signal we encountered, it would have a constant audio strength. The tool that the receiver uses in an attempt to accomplish this lofty goal is the automatic gain control.
The AGC circuit uses the strength of the signal to adjust the gain (amplification) of the receiver. As the signal goes up in strength, the gain of the receiver goes down. So, the AGC control signal is a direct indication of the signal strength. This assumes that a larger AGC control signal reduces the receiver gain, which is often the case.
In many designs, the AGC control voltage is simply scaled and sent to the actual S Meter. It's also common that the RF gain control is implemented in this portion of the overall circuit. One indication of this might be that reducing the RF gain causes the S Meter to deflect upward. This happens because the RF gain control reduces the gain of the receiver, which is the same as what happens when a strong signal is received. In other words, the RF gain control fools the receiver into thinking that there is a strong signal present, so the receiver reduces its gain, and the S Meter deflects upwards, showing the strong but artificial signal.
There is no good reason to believe that this design approach will created a calibrated S Meter. Usually any design decisions are made in favor of AGC operation, which is the primary goal. Compensation circuits could be added to improve the operation of the S Meter, but this would add to the cost of the receiver. They are often not included.
Since a calibrated S Meter would be useful, and the scale usually includes both S Units and dBs, the notion of standards and calibration comes up from time to time - in particular, the mapping between S Units and decibels (dB). Values such as 4 dB, 5 dB, and the most common 6 dB per S Unit have been talked about. In the end, no standard really exists, and even if it did, very few radios implement it.
A few words on the test setup that I used to make the measurements presented in the next section. My equipment consisted of all of the HF radios (receivers) I could easily get my hands on, and two important devices. The first was an RF signal generator, in this case, an old Heathkit IG-102S. The second device was an MFJ-762 step attenuator. The quality of my measurements comes down to the accuracy of the attenuator. Most of these 50 ohm attenuators are built around precision resistor networks built into shielded compartments (to reduce signal leakage around an attenuator section). This step attenuator provided 1 dB steps between 0 dB and 81 dB of attenuation.
|
|
MFJ-762 Step Attenuator |
Another factor that will influence the quality of the measurements is my eye, since it was used to determine when the S Meter was exactly at some particular S Meter position. My measurements were made at the integer S Units (S0 to S9), and 10 dB increments about S9. These points, in general, are always marked on S Meters. As I changed the attenuator, I watched the S Meter, looking for the the meter to exactly achieve the target marking. In the case of radios which work with my S Meter Lite software, I used the program as opposed to the meter since I believe that the program window is much easier to read, and it is a faithful reproduction of the S Meter.
|
Heathkit IG-102S RF Signal Generator |
I adjusted the RF signal generator so that the S Meter produced an S9 reading. The RF generator was connected to the radio through the attenuator, and I used at least 20 dB of attenuation for most all readings in order to reduce the chance that the RF generator output might be influenced by changes in the load (the receiver).
I stepped through attenuation settings until the meter achieved the desired reading. Here's where my eye matters. I recorded the attenuation value for this meter reading. S9, therefore, became my zero reference level. The S Meter values below S9 are captured as negative decibel values. I would return the attenuator to the S9 level between each measurement, to make sure that something had not changed across the few seconds needed to adjust the attenuator.
In order to measure the S Meters above S9, I started off by setting the attenuator to a large level, such as 60 dB. I then adjusted the RF generator to produce an S9 meter level. Then I took attenuation away until the meter deflected up to the desired mark. I recorded the amount of attenuation that I removed.
The S Meter measurements I made are shown in the following table. I measured the number of decibels needed to achieve a certain S Meter deflection, relative to S9. I considered S9 to be 0 dB. Each radio was measured at three different frequencies, in order to see if the S Meter deflection was a function of frequency. The frequencies were 3.5 MHz, 14.2 MHz, and 28.5 MHz. They are shown as column headings in the table. All measurements were made with the radio preamp off. Please note that I also made measurements with the preamp on, but that data is not included on this page. The more extensive data is available as a PDF document. An X indicates that I was unable to make a reliable reading, usually due to instability. A blank cell indicates that a reading was not taken at that point.
Radio |
||||||||||||||||||||||
S Meter Level |
ICOM 756PRO |
ICOM 756 |
ICOM 706 MIIG |
ICOM 765 |
Yaesu FT-1000MP MK V |
Yaesu FT-920 |
Kenwood TS-440 |
Kenwood TS-830 |
||||||||||||||
| 3.5 | 14.2 | 28.5 | 3.5 | 14.2 | 28.5 | 3.5 | 14.2 | 28.5 | 3.5 | 14.2 | 28.5 | 3.8 | 14.2 | 28.5 | 3.5 | 14.2 | 28.5 | 3.5 | 14.2 | 28.5 | 14.2 |
|
| +60 | X | X | 56 | X | X | 57 | 35 | 35 | 35 | X | X | X | 60 | X | X | X | 49 | 48 | 50 | X | ||
| +50 | 46 | 46 | 46 | 50 | 50 | 50 | 26 | 26 | 27 | 49 | 49 | 50 | X | X | X | 44 | 44 | 42 | X | |||
| +40 | 39 | 36 | 37 | 41 | 41 | 40 | 21 | 21 | 20 | 39 | 39 | 40 | 40 | 47 | 46 | 46 | 33 | 33 | 35 | 30 | ||
| +30 | 29 | 27 | 29 | 33 | 35 | 33 | 15 | 16 | 16 | 29 | 29 | 30 | 37 | 35 | 37 | 26 | 25 | 15 | 23 | |||
| +20 | 20 | 19 | 19 | 23 | 25 | 23 | 10 | 10 | 10 | 19 | 19 | 20 | 20 | 25 | 23 | 25 | 16 | 16 | 7 | 15 | ||
| +10 | 10 | 8 | 8 | 11 | 11 | 11 | 5 | 5 | 5 | 9 | 9 | 10 | 10 | 11 | 10 | 11 | 7 | 7 | 0 | 8 | ||
| S9 | 0 | 0 | 0 | 0 | 0 | 0 | 0 | 0 | 0 | 0 | 0 | 0 | 0 | 0 | 0 | 0 | 0 | 0 | 0 | 0 | 0 | 0 |
| S8 | -3 | -3 | -3 | -5 | -5 | -5 | -5 | -5 | -5 | -5 | -5 | -5 | -8 | -9 | -9 | -9 | -4 | -4 | -4 | -6 | ||
| S7 | -6 | -6 | -5 | -9 | -9 | -8 | -11 | -11 | -10 | -10 | -9 | -10 | -13 | -14 | -14 | -14 | -7 | -8 | -7 | -10 | ||
| S6 | -8 | -8 | -8 | -12 | -12 | -12 | -16 | -16 | -16 | -15 | -13 | -15 | -16 | -19 | -19 | -19 | -11 | -10 | -11 | -15 | ||
| S5 | -10 | -10 | -9 | -15 | -15 | -15 | -20 | -21 | -20 | -17 | -17 | -18 | -18 | -22 | -23 | -22 | -15 | -15 | -14 | -20 | ||
| S4 | -12 | -11 | -11 | -18 | -17 | -18 | -22 | -23 | -22 | -19 | -20 | -19 | -20 | -24 | -25 | -24 | -18 | -18 | -18 | -23 | ||
| S3 | -14 | -13 | -12 | -19 | -20 | -20 | -23 | -24 | -23 | -21 | -23 | -20 | -21 | -26 | -26 | -26 | -22 | -22 | -22 | -24 | ||
| S2 | -15 | -15 | -14 | -21 | -22 | -21 | -24 | -25 | -24 | -23 | -24 | -24 | -22 | -27 | -27 | -27 | -26 | -25 | -27 | -26 | ||
| S1 | -17 | -17 | -15 | -23 | -23 | -23 | -25 | -26 | -25 | -24 | -25 | -25 | -23 | -28 | -28 | -28 | -32 | -31 | -32 | -28 | ||
| S0 | -19 | -18 | -17 | -24 | -25 | -26 | -26 | -27 | -26 | -26 | -26 | -27 | -25 | -31 | -30 | -30 | -38 | -40 | -39 | X | ||
Four of the radios were in the same physical location, and I was able to compare their S9 signal levels against each other. The ICOM 756PRO was the reference radio. These comparisons were made with the preamps off, at 14.2 MHz. The same signal level produced the following S Meter readings:
| Constant Signal Level S Meter Readings | ||||
| ICOM IC-756PRO | ICOM IC-756 | Yaesu FT-920 | Kenwood TS-440 | ICOM IC-706MIIG |
S9 |
S9+5 dB |
S8.25 |
S7 |
S9+5 dB |
I found that the attenuator on the ICOM IC-756PRO, ICOM-756, and Yaesu FT-920 were accurate at 14.2 MHz. I did not measure the attenuator performance at any other frequency. On these radios, the attenuator is marked as being 6, 12, and 18 dB.
The attenuator on the IC-706MIIG was measured to be 18 dB.
The attenuator on the TS-440, which was not marked with a value, measured as 20 dB at 14.2 MHz.
On the ICOM IC-756PRO, preamp #1 measured 10 dB and preamp #2 measured 16 dB, at 14.2 MHz. On the ICOM IC-756, preamp #1 measured 10 dB and preamp #2 measured 20 dB, at 14.2 MHz. On the Yaesu FT-920, the preamp measured 11 dB at 14.2 MHz. On the IC-706MIIG, the preamp measured 10 dB at 14.2 MHz.
The table shown above is but part of the data I measured. In particular, it does not include the effect of the receiver preamp. On some radios, the preamp did indeed alter the response of the meter. If you are interested, the complete data is available as a PDF document.
Not all S Units are created equal. Depending upon the radio and the S Unit (S0 to S9), the value of an S Unit, as measured in dBs, changes quite a bit. It can range from less than 1 dB to almost 10 dB. Let's say that the other station in your QSO turns on their amplifier. Your radio is the Yaesu FT-920. The meter moves from S7 to S9. With the mythical 6 dB/S Unit, that would be a 12 dB difference - right? Well, on my FT-920, it's more like 14 dB. That's actually not too far off. But what if the signal is not that strong, and the meter moves from S2 to S4. That's also 2 S Units, so again we should have 12 dB - right? Now, that assumption is very wrong. In truth, the difference between S2 and S4 on my FT-920 is 3 dB (at best).
I don't want to single out the FT-920, all of meters are inaccurate. In general, my observations were:
If you want to make a relative measurement, get the signal above S9, into the pure dB portion of the scale. Most (but not all) meters tended to be within 6 dB of the correct value between S9 and S9+50 dB.
The range between S6 and S9 tends to cover at least 10 dB, and if you know the response of your radio, you can make a decent estimate of dB difference.
Below S6, meters tend to get very sensitive, which to me means that the number of dB per S Unit drops, even as low as less than one dB per S Unit.
Many radios had a true spread of approximately 10 dB between S0 and S5.
If there were such a thing as an ideal S Meter, and each of its S Units were equal to 6 dB, its data table would look like:
S Meter Level |
Ideal S Meter |
||
| 3.5 | 14.2 | 28.5 | |
| +60 | 60 | 60 | 60 |
| +50 | 50 | 50 | 50 |
| +40 | 40 | 40 | 40 |
| +30 | 30 | 30 | 30 |
| +20 | 20 | 20 | 20 |
| +10 | 10 | 10 | 10 |
| S9 | 0 | 0 | 0 |
| S8 | -6 | -6 | -6 |
| S7 | -12 | -12 | -12 |
| S6 | -18 | -18 | -18 |
| S5 | -24 | -24 | -24 |
| S4 | -30 | -30 | -30 |
| S3 | -36 | -36 | -36 |
| S2 | -42 | -42 | -42 |
| S1 | -48 | -48 | -48 |
| S0 | -54 | -54 | -54 |
If each S Unit was equal to 4 or 5 dB, the S Unit entries would scale accordingly. We see that no matter what frequency, the S Unit portion of the scale corresponds to 6 dB per S Unit, and the scale above S9 measures decibels accurately. Keep this ideal table in mind when considering the performance of each S Meter.
The ICOM IC-756PRO had the smallest range from S0 to S9, approximately 18 dB. In addition, the S Unit to dB mapping was more frequency dependent than on the other radios. If you look at the extended data, you'll see that the preamp also changes the mapping. Above S9, accuracy was fairly good, especially at the +20, +30, and +40 points.
Additional 756PRO S Meter information is presented later on this page.
The ICOM IC-756 S0 to S9 range was approximately 25 dB. As is seen on most of the meters, the widest dB interval is at S9, in this case, 5 dB between S8 and S9. As you go down in S Units, however, the dB spacing between S Units becomes less and less. The accuracy above S9 was very good. While the preamp did impact the S Unit to decibel mapping, it was much less of a factor than on the 756PRO.
The ICOM IC-706MIIG S0 to S9 range was approximately 26 dB. S5 to S9 was a broad 20 dB, which suggested 5 dB per S Unit. Below S5, however, the meter became extremely sensitive, approximately 1 dB per S Unit. Above S9, the meter was very inaccurate, spanning 35 dB for a meter range of 60 dB. The band choice and preamp did not make much of difference on the measurements.
The ICOM IC-765 preamp added 9 dB of gain at 14.2 MHz. The attenuator has three labeled positions 10, 20, and 30 dB. I found the attenuator to be accurate at 14.2 MHz.
These measurements were provided by K3LR, and are included with permission. Measurements were made with the use of an IFR1500 calibrated signal generator. Measurements were made at 3.8 MHz, IPO off, LSB SSB, and in the tuned front end mode.
Even though this radio is clearly an excellent and contemporary design, the S Meter accuracy and performance trends follow most of the other radio. The S0 to S9 range is only 25 dB, and the lower S numbers are approximately 1 dB apart. Above S9, however, the meter is very accurate.
On December 28th, 2001, I learned of some S Meter measurements made by Tom, W7GT. These measurements are specific to his FT-1000MP (not Mk V), and are included near the end of this page.
The Yaesu FT-920 S0 to S9 range was approximately 30 dB. The meter was not influenced by frequency or preamp. The scale became very compressed between S1 and S4. Often times, the S Units were less than a dB apart. Accuracy above S9 was not as good as on some of the other radios tested.
This radio had the largest decibel range between S0 and S9, approximately 40 dB. In addition, spacing between S Units, although becoming compressed at the lower end, was much more consistent than on the other radios. Above S9, the meter was not very accurate.
An old workhorse. The S Meter scale stopped at S9+40 dB.
All of the radios presented up to this point on this page have been amateur radio transceivers. A transmitter and a receiver united in a single cabinet. There are other categories of radios. In particular, there are receive-only radios designed for shortwave listeners (SWL). Mark Connelly, WA1ION, measured the S Meter performance of two shortwave receivers, the Drake R8A, and the Palstar R30. He used a high quality calibrated RF signal generator to measure the response of the S Meters. Please visit his page for the test results.
From his information, the accuracy of the S Meters on both receivers is very good, especially when compared to the transceivers mentioned on this page. The Drake R8A appears to be very good. It comes very close to the mythical 6 dB/S Unit, and it's S9 signal level of -71 dBm is very close to the standard of -73 dBm.
S Meters are clearly not very accurate nor consistent, although some are better than others. In some radios, the S Meter calibration is a function of frequency. Your S Meter may differ from mine, even in the case of the same brand and model of radio. If you want to trust and know your meter, you should spend some time with your receiver and a calibrated signal source, mapping S Meter deflection to known dB changes. The S Meter Lite program helps provide more accurate readings, but only a small subset of all of the common receivers support remote S Meter reading.
I was dreaming about the ideal S Meter. It covered a wide range, and was very accurate. I then realized that most of the time, a given signal would simply wander around in a very small part of the overall meter range. I might even think that something was wrong with my radio. I suspect that S Meters have evolved over time to be considered interesting, as opposed to accurate. We like to see the meter bounce as words are spoken, or dits and dahs are sent. And, if the radio maker does not provide a definition of their S Unit, then they are under no obligation to do anything. The dB portion of the S Meter, above S9, does tend to be the most accurate portion of the meter. There seems to be very little complaint about S Meters. I don't remember hearing somebody claim that they made a radio purchase decision based solely upon the S Meter. They have become what they are. I don't mind that, unless I am in the mood to make some actual comparisons.
I would like to thank Val, W8KIC, for lending me the RF signal generator. I would like to thank Frank, NN3T, for lending me his IC-706MIIG. Thanks to K3LR for allowing me to use his Yaesu FT-1000MP Mk V data. Thanks for Tom, W7GT, for his extensive FT-1000MP data. Thanks to Greg, W8GB, for access to the ICOM IC-765, Kenwood TS-830, and the pizza.
On December 28th, 2001, Tom Rohlfing, W7GT, presented the results of a number of S Meter measurements made on his FT-1000MP, using an Hewlett Packard HP E 4432B calibrated RF signal generator. The information was provided to the FT-1000MP mailing list, located at www.qth.net. With his permission, I am going to reprint his data on this page. First, I will reproduce his data graph. Then, a portion of his comments will be displayed in a box, Finally, I will add a few of my own observations.
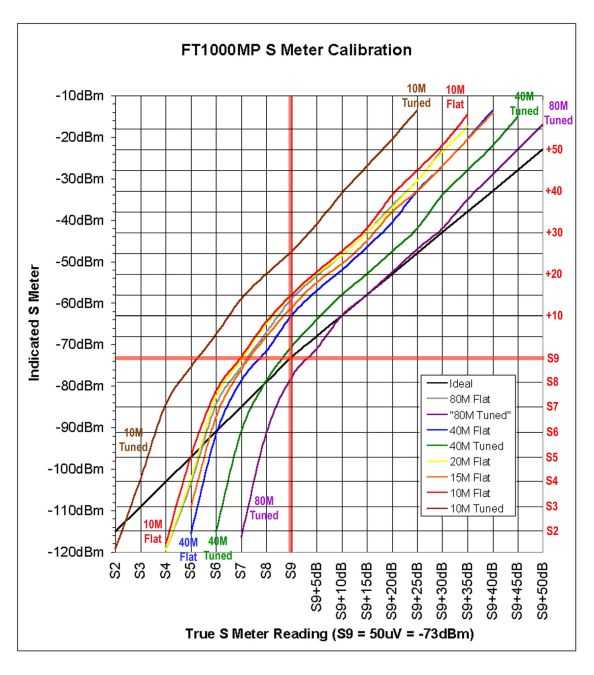 |
| W7GT Measured Data from his FT-1000MP |
| The horizontal axis is the
"true" S meter reading you should get from a
perfect radio, with S9 = -73dBm and 6 dB per S-unit. The vertical axis
shows the readings I got from my MP. For example, if you look at the purple
curve (the one labeled "80M Tuned") when I put in an S9 signal (-73dBm), the
S-meter on the MP actually read a little over S8 (-78 dBm or so). The right edge of the vertical scale shows the S-meter values read off the MP's meter (actually read using S-Meter Lite). The left edge of the vertical scale shows the power levels (dBm) which correspond to the S-meter readings on the right. In other words, it's just the MP's S-meter, but with the scale labeled in dBm, rather than S-units. The black line is the curve I would have expected from a perfect S-meter in the radio. I put a heavy orange line at S9 on each axis. Note, as I said in my first email, that the SLOPE of the curves isn't bad for larger readings on the S-meter. But they all drop off quickly when the meter reading on the MP gets below about S9 or so. Note how few dB it takes to get from S7 down to S2! The curve for "80M Tuned" tracks reality pretty well from about S9+5 on up. I wish they were all that way. Other than 80M tuned, and 40M tuned, all the others are really hot, leading to giving very generous S-meter readings. Look at how bad the 10M Tuned is! FYI, I have the Inrad mod installed, and I have turned down the Menu 9 IF gain setting from 12 to about 10, as the instructions indicate. |
W7GT Data Commentary (edited only for length) |
Tom introduces a new concept to the S Meter story which I had otherwise ignored on this page. That is, the idea of using the S Meter as an absolute strength indicator in addition to a relative strength indicator. All of my measurements were designed to investigate how relative changes in signal level were reported by the meter. Given my ancient signal generator combined with a step attenuator, that was all that I could hope to measure.
There does exist, however, a conventional-wisdom standard that claims that S9 on an S Meter should be equivalent to a 50 microvolt RMS signal at the receiver input terminal. Tom calculated that a 50 microvolt RMS signal level is equivalent to a -73 dBm level, and his left vertical data scale has units of dBm. Since Tom had a calibrated signal generator, he was able to add that absolute factor into his measurements. So, his detailed graph presents both relative and absolute information, for a number of bands.
The graph contains a straight black line which represents an ideal S Meter. This ideal meter would track dB's above S9, and would have 6 dB per S Unit response below S9. This is equivalent to the data in an earlier data table on this page. On the graph, measured data lines tend to run parallel to the ideal response above S9, but below S9, the lines curve downward, becoming more vertical. When a measured data line runs parallel to the ideal response line, it represents an S Meter which is relatively accurate, but not absolutely calibrated. On this radio, above S9, all of the measured data lines tend to run parallel to the ideal, which indicates a good relative response. Only the 80 m tuned data tends to overlap the ideal response, and that is only between the S9+10 dB to S9+30dB range. For that range, on that band, Tom's S Meter was nearly perfect, both in relative and absolute terms.
The nonlinear and nonparallel to ideal behavior measured below S9 supports the trend seen in other radio's S Meters. That is, an S Unit is not 6 dB, and as you get closer to S0, each S Unit measures far less change in signal level. Consider, for example, the results of the 80 m tuned test. An ideal meter, moving between S7 and S8, actually measured as moving between S2 and S6. On the ideal meter, one S Unit is 6 dB, so that indicates that the real radio has a 6 dB spread between S2 and S6 on its meter. By the way, the results reported by K3LR, for his FT-1000MP Mk V radio, shown in the main data table, exactly confirm this measurement. That is the difference between S2 and S6 is actually 6 dB, not 24 dB, as the mythical 6 dB/S Unit would suggest.
On December 31th, 2001, Bob Marzari, W3PT, presented the results of a number of S Meter measurements made on his ICOM IC-756PRO radio. Bob made the measurements using the Agilent 8920 RF Communications Test Set. This device is a single box that makes a number of measurements related to cellular and land mobile radio communications. Part of the box includes a calibrated RF signal generator. The information was announced to the ICOM mailing list, located at www.qth.net. With his permission, I am going to reprint some of his data on this page.
One of Bob's tables measured the response of the S Meter on 14.2 MHz, without the use of the preamp. That measurement is interesting in that it repeats the measurements I made on my 756PRO using an RF signal generator along with a step attenuator. His measurements are slightly more informative because they were made in dBm. As stated in the previous section, -73 dBm is equivalent to a 50 microvolt signal level, which is considered by some to be the desired value for an S9 meter reading.
The next table shows Bob's dBm data, then that data converted to relative dB centered around S9. That's the way that I presented my data earlier on this page, and, for comparison sake, I will repeat my 14.2 MHz data.
|
||||||||||||||||||||||||||||||||||||||||||||||||||||||||||||||||||||
W3PT IC-756PRO S Meter Data |
The S9 signal level, -68.8 dBm, is 4.2 dB less sensitive than the -73 dBm, the suggested standard for S9. Beyond that, Bob's numbers appear to track mine, quite closely. In the case of this radio, I believe that the close tracking between two different sets is due to the substantial use of digital technology in the AGC path. The 756PRO has a DSP final IF, where the AGC is generated. The S Meter is directly driven from digital circuitry, not a conventional analog design. This probably implies that all 756PRO radios will have S Meters with a similar response.
Back to my Experimentation Page
